
Long-Term Effects of Behavioral Interventions on Energy Conservation
Organization : Harvard Kennedy School
Project Overview
Project Summary
Households were sent reports providing individualized feedback about their energy use and comparing it to that of their neighbors.
Impact
Consumers provided with personalized home energy reports demonstrated immediate reductions in their energy consumption, and those who continued to receive reports after 2 years continued to demonstrate reductions in energy usage.
Challenge
Traditionally, utility companies have tried to promote energy conservation by providing subsidies for energy-efficient appliances. But recently there has been an increased focus on influencing consumer behavior. Many utilities work with a company called Opower to produce home energy reports, which provide customers with individualized feedback and comparisons to neighbors’ energy consumption. Though numerous studies have considered Opower’s short-term effects, this project’s goal was to examine the program over a longer time horizon, both for households that continue to receive reports and for households that no longer receive them.
Design
The households included in this project were single-family homes at 3 sites in the Midwest and West Coast. They were randomly assigned to receive reports either for two years or indefinitely.
In Sites 1 and 2, treatment group households were randomly assigned to receive monthly or quarterly reports. In Site 3, heavier energy users were assigned to receive monthly reports while lighter energy users were assigned to receive quarterly reports.
The Opower reports have three main components – the Neighbor Comparison Module, Individualized Feedback, and the Action Steps module.
- The first page of each report is a Neighbor Comparison Module, featuring graphs of a household’s recent energy usage in comparison to that of 100 neighbors with similar house characteristics.
- The second page features Individualized Feedback that is personalized based on energy usage. Individualized feedback could consist of a graph comparing a household’s current energy consumption to its past consumption, or trends in usage compared to its neighbors.
- The second page also contains an Action Steps module, which outlines concrete steps – personalized based on a household’s energy usage – that can be taken to conserve energy.
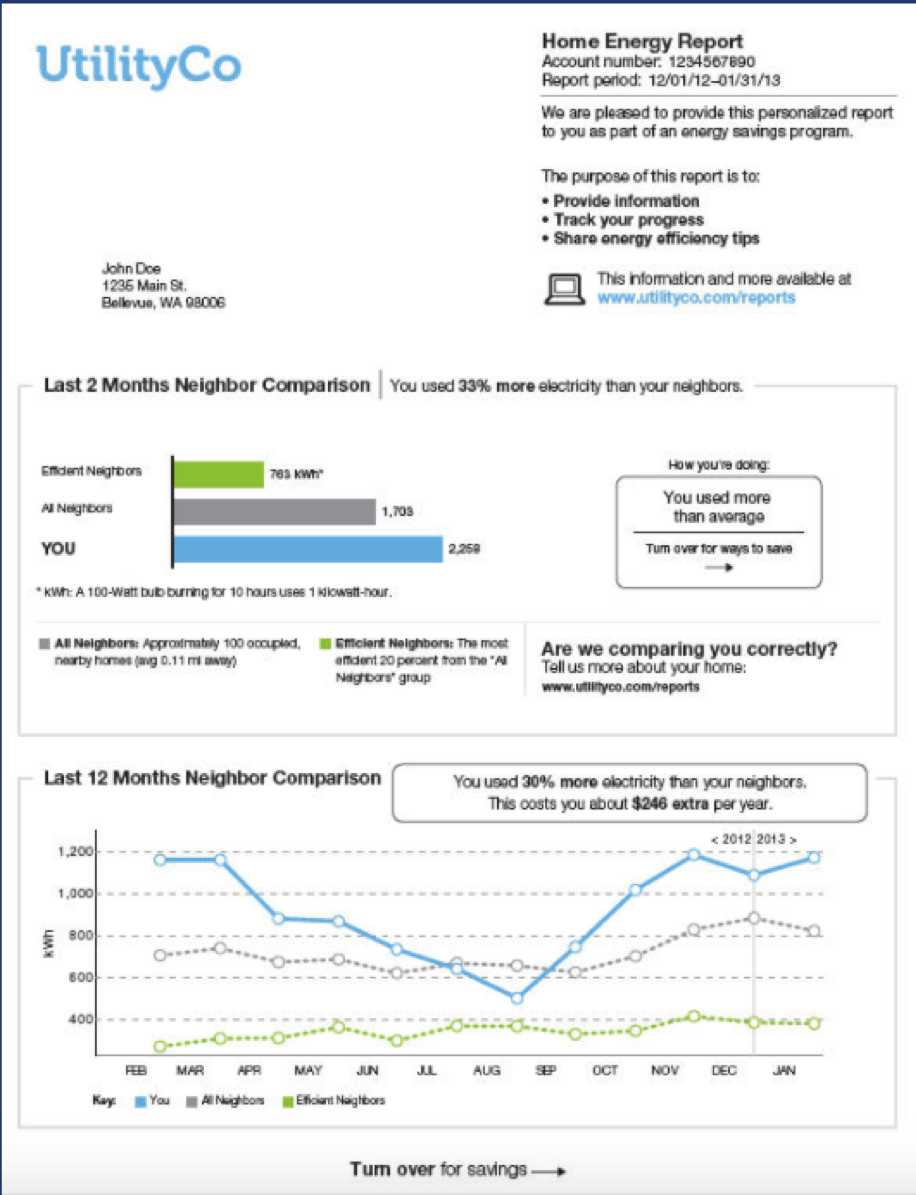
First page of Home Energy Report
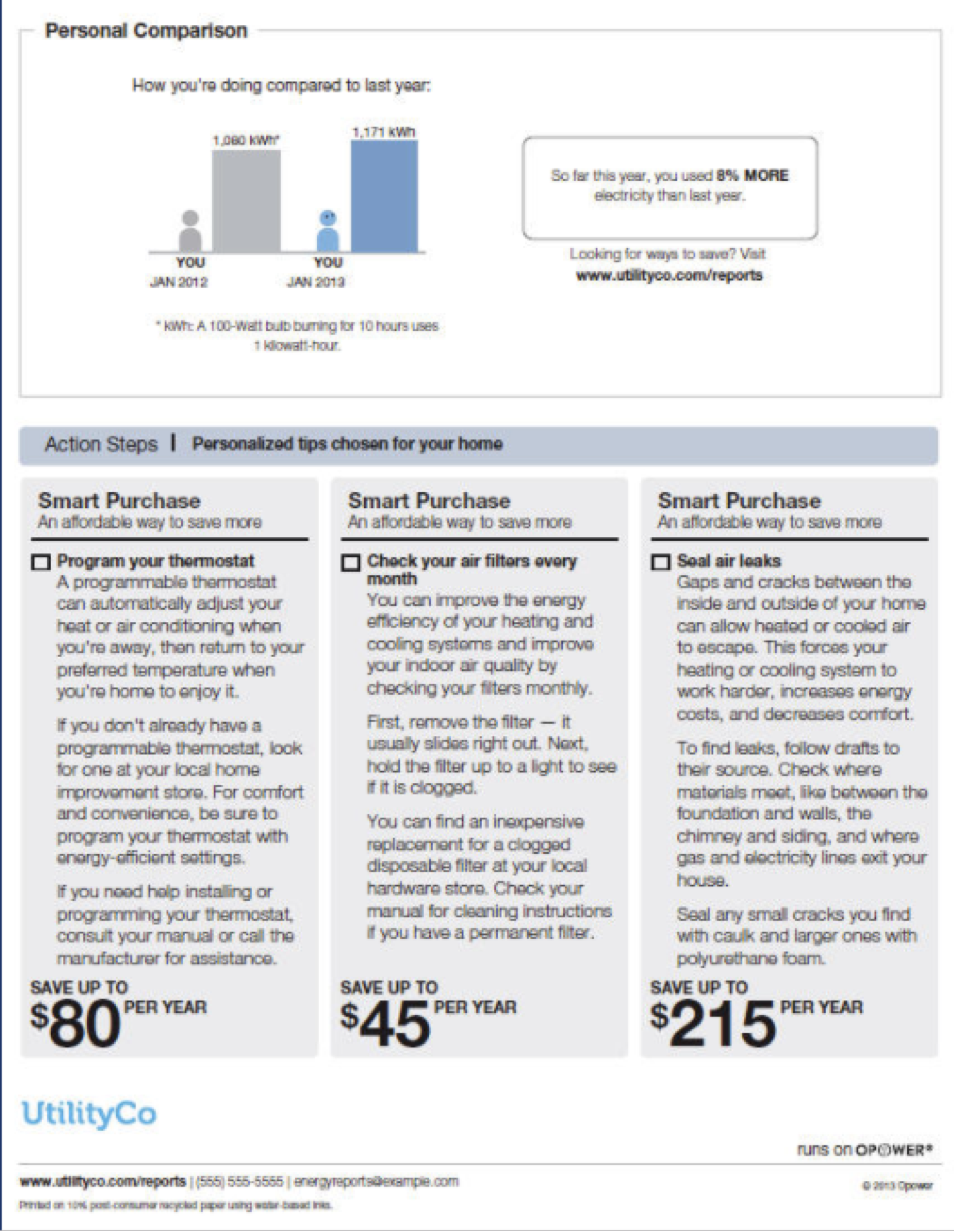
Second page of Home Energy Report
Impact
In a randomized evaluation, households that received the Opower reports exhibited an initial “action and backsliding” pattern. Consumers reduced their average electricity usage by 1 to 1.3 percent within two weeks of receiving an Opower report. A similarly marked reduction in energy usage was also observed immediately after the second Opower report was sent 1 to 3 months later. Yet, consumers also appeared to backslide on their immediate conservation actions. For the group receiving quarterly reports, the treatment effect weakened by 0.2 kilowatt-hours per day between receipt of the first and second reports, meaning that half of their initial conservation actions were discarded within two months. By the time they received their fifth reports, their immediate reduction in energy use was five times smaller than the decrease upon receipt of the initial four reports.
Where reports were discontinued after two years, the report effects decayed at a rate of about 10 to 20 percent per year. This rate of decay, estimated at 0.708 kilowatt-hours per day per year, was four to eight times slower than the decay rate between initial reports, which depending on frequency of reports ranged from 0.09 to 0.18 kilowatt-hours per day per year. The reports may have prompted recipients to purchase energy-efficient bulbs and appliances to keep household energy consumption low even after they stopped receiving reports. If this linear trend in decay rates continued, the effects of treatment would not return to zero for five to ten years after the discontinuation of reports.
Where reports were continued beyond two years, households continued to demonstrate reductions in energy usage, demonstrating that consumers do not fully develop new habits even after two years. In years 3 through 5, households that continued receiving reports experienced treatment effects that were 50 to 60 percent stronger than households that stopped receiving reports.
The study suggests that an effective approach to encouraging conservation is repeating the intervention until customers have purchased energy efficient appliances to create long-term energy savings, and then to reduce treatment intensity after this has happened. The two-year intervention (1.43 cents per kilowatt-hour) was much more cost-effective than the one-shot intervention (4.31 cents per kilowatt-hour), suggesting that the first report does not allow enough time for people to habituate and to purchase more efficient appliances that contribute to conservation. The four-year intervention had mixed effects: reduced-intensity sites where households had their treatment reduced to biannual reports after two years exhibited even better cost-effectiveness of 0.69 cents per kilowatt-hour; however, regular-intensity sites in the four-year intervention were ultimately less cost-effective than those in the two-year intervention.
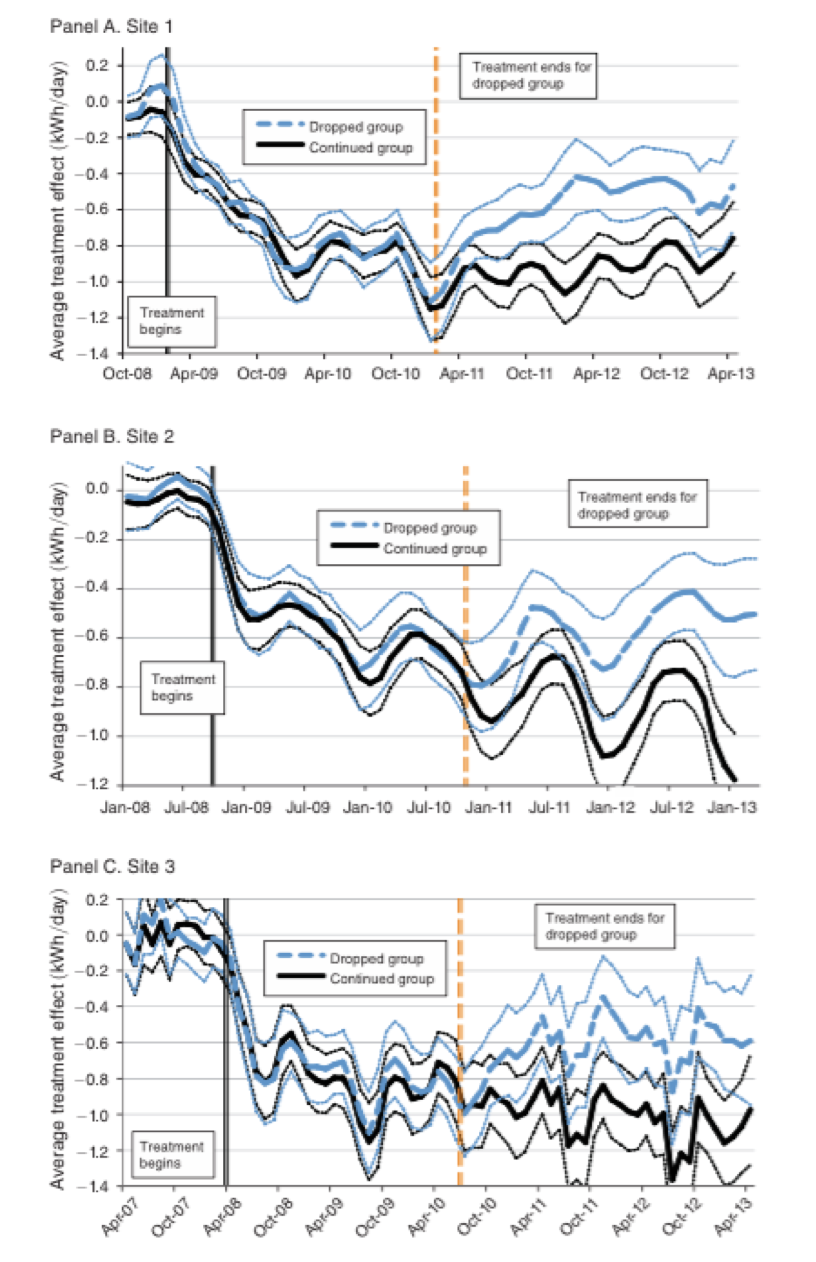
Long-term effects of Opower reports
Implementation Guidelines
Inspired to implement this design in your own work? Here are some things to think about before you get started:
- Are the behavioral drivers to the problem you are trying to solve similar to the ones described in the challengesection of this project?
- Is it feasible to adapt the designto address your problem?
- Could there be structural barriers at play that might keep the design from having the desired effect?
- Finally, we encourage you to make sure you monitor, test and take steps to iterate on designs often when either adapting them to a new context or scaling up to make sure they’re effective.
Additionally, consider the following insights from the design’s researcher:
Factors that are especially important to implementing the intervention effectively include:
- Determining the frequency of reports (whether monthly or quarterly), whether frequency should change over time, and when (if ever) treatment should be discontinued.
- Monitoring households for attrition, which usually occurs when customers move. In this study, 5 percent of households per year became “inactive” and this post-move data is excluded from analysis.
- Providing households with the option to opt-out of receiving reports. In this study, about 2 percent of the treatment group opted out, although their data is still observed and included in the analysis.